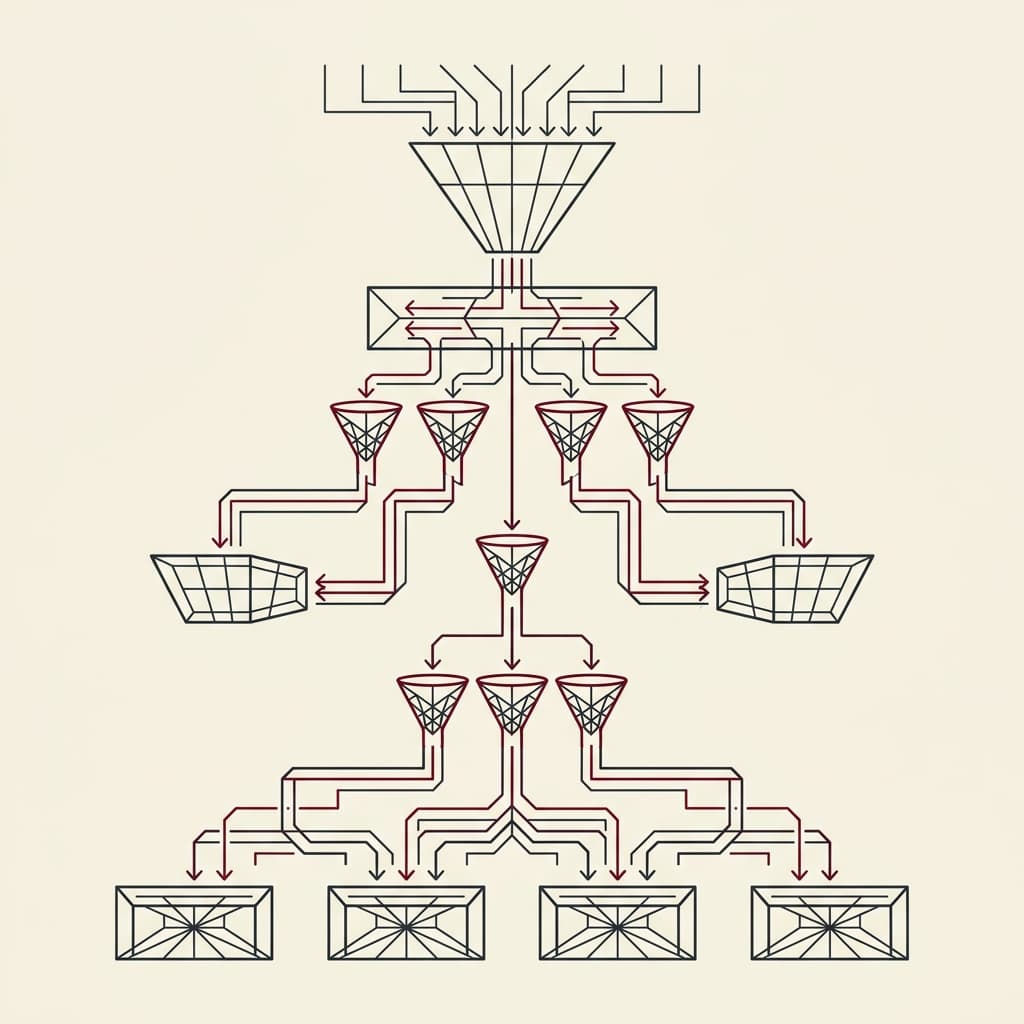
Accessing information is easy; turning it into a decision is not. Between the two there's a process —collect, filter, analyze— that almost nobody gets right. This is the way I do it, distilled from years of researching brand, market, product and, above all, learning on my own.
Research as the foundation of learning
Research is the opening stage of nearly any work methodology, even if it goes by a different name depending on the framework:
| Methodology | What it calls research |
|---|---|
| Design Thinking | Empathize and Define |
| Project Management | Plan and Analyze |
| Human Centered Design | Discover and Understand |
The techniques and tools vary, but underneath there are always three pillars: frame the problem, collect data and analyze it. Let's take them one at a time.
1. Framing the problem
It's the foundation of everything and usually starts from a hypothesis, an objective or a prior analysis. It's worth writing it down as a clear and concise document that answers a few key questions:
- What do we want to discover or achieve?
- Why does it matter?
- What is the origin or hypothesis of the topic?
- Who are the key players?
- What will be the population or object of the research?
- What is the scenario or environment to measure?
- How are we going to measure it?
- How much time do we have?
These questions are the filter that decides the tools, the techniques and the scope of the next phase. Without them, you collect blindly.
2. Data collection
Types of data
Before choosing a tool, you have to know what you're looking for. Data can be qualitative (it describes) or quantitative (it counts):
| Type | What it captures | Examples |
|---|---|---|
| Nominal | Categories that share a trait | Genders, types, locations, brands, sizes, colors |
| Ordinal | A hierarchy | Levels, classifications, stages, rankings |
| Binary | Only two answers | Yes/No, True/False, booleans |
| Textual | Subjective information in free text | Comments, descriptions, narratives |
| Type | What it captures | Examples |
|---|---|---|
| Discrete | Whole numbers, a single figure | Votes, units sold, no. of customers |
| Continuous | Precise measurements and ranges | Temperature, volume, distance, weight, time |
How to extract the information
Once you know which data you want, you define how you'll reach it. There are two main routes:
- Primary collection — gathering and classifying raw data from the original source: surveys, interviews, observation.
- Opensource Knowledge — using public information, without accessing anything confidential, through search engines, websites, social networks and extraction tools. (It's the practical method behind the idea I develop in Opensource Knowledge: learning without limits.)
Primary collection
- Survey. Ideal for qualitative data, especially with single choice, true/false or short answers.
- Interview. Direct, in-depth information. With open, focused questions you understand the perspectives, motivations and challenges of the people involved.
- Role play. Simulating a real situation in which participants take on different roles to experience the problem from the inside.
- Re-label. Taking a competitor's product, stripping its brand and presenting it to the user as your own to gather feedback. It saves time: the prototype is already built.
- Monitoring. Continuous collection and evaluation of data. Automated monitoring uses sensors, trackers and web scraping to analyze in real time without human intervention.
- Mystery shopping. Evaluating service quality and compliance with standards without the staff knowing they're being observed.
Observation tools
To see what users do: Hotjar evaluates behavior inside your site (heatmaps, recordings); online eye tracking (like GazeRecorder) tracks where the gaze lands. Useful for turning behavior into data.
Opensource Knowledge: researching with open sources
-
AI filtering. Models with internet access compare many large sources in minutes and are excellent at paraphrasing, organizing and associating ideas. Perplexity reads articles, searches for references and builds answers citing them; ChatGPT and Claude with search do similar tasks; NotebookLM summarizes and connects your own sources. For video, the extensions that pull a YouTube transcript and summarize it save you hours of watching.
-
Search operators. Special words that narrow or broaden results in Google, Bing or even marketplaces:
filetype:pdf [search]— forces a specific file format.Regional * champion— the*is a wildcard that matches any word.site:[site] [search]— searches only within a domain.related:[site]— finds sites similar to a reference."research techniques"— the quotes search for the exact phrase.football -world— the dash excludes a term.- Reverse image search — find the origin or variants of an image with TinEye or Google Images.
-
Social and blog trends. Pages to spot which videos and posts are racking up the most views and shares (like Buzzsumo or each network's trends tools).
-
Sneak peeks analysis. Examining videos and documents —often communication material for private or paid content— that leak names or screenshots you can then trace on your own.
-
Web history. Revisiting how a site evolved (design, content, functionality) with the Wayback Machine: what a website said years ago.
-
Research organizations. Reliable, specialized sources; each topic calls for its own. Some I use: Our World in Data and the go-to sector reports.
-
Search and market analytics. Sites that show what's being searched for and where trends are heading: AnswerThePublic, Ahrefs, Google Trends.
The kit changes; the method doesn't
Specific tools age fast (an AI search engine today isn't the one from two years ago). What stays is the sequence: define which data you need → choose the route (primary or open source) → verify the source. Learn the method, not the brand.
3. Data analysis
With the data collected, it's time to turn it into answers to the questions from the framing. There are four approaches, from least to most ambitious:
- Descriptive — what happened. Summarizes and presents the data (tables, charts, statistics) to give a general understanding of how it's distributed.
- Diagnostic — why it happened. Looks for the causes: relationships between variables and the reasons behind a pattern or trend.
- Predictive — what will happen. Uses historical data to anticipate an event or trend (demand for a product, performance of a stock).
- Prescriptive — what to do. Recommends the optimal action for a situation, combining data and information to solve the problem or seize the opportunity.
Data visualization
Data you can't see is hard to decide on. Bringing information into a clear visual form is what lets you move from analyzing to ideating. Some options:
- Frameworks. Templates that organize the findings: User Persona, User Journey, Blue Ocean, Benchmarking, Empathy Map, Environment Map… there are plenty.
- Mind maps. To organize ideas, concepts and their relationships in a structured way.
- Bar charts. Vertical for growth; horizontal for a temporal relationship.
- Radial charts. The "pie chart" compares percentages within a single category; the "spider chart" shows relationships between categories of the same topic.
- Pyramid diagrams. The pyramid sets hierarchies; inverted (funnel), the steps of a process.
- Scatter plots. For distance and intersection between ideas.
- Arrow or ladder diagrams. For linear processes and growth structures.
Closing: research is learning on a loop
Visualizing information well gives you a picture that's easy to understand, and from there you can already ideate and decide. But research doesn't end: it's a continuous stage of learning, so it pays to stay current and open to new techniques and tools.
I hope this map helps you research on your own. If you want the why behind the method —why anyone today can access this knowledge— I tell it in Opensource Knowledge: learning without limits.
Originally published in 2023 and updated in 2026, now under the concept of Opensource Knowledge.